GRAPH THEORY
INTRODUCTION
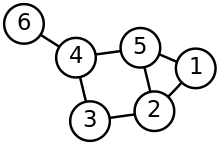
In mathematics, graph theory is the study of graphs, which are mathematical structures used to model pairwise relations between objects. A graph in this context is made up of vertices (also called nodes or points) which are connected by edges (also called links or lines). A distinction is made between undirected graphs, where edges link two vertices symmetrically, and directed graphs, where edges link two vertices asymmetrically; see Graph (discrete mathematics) for more detailed definitions and for other variations in the types of graph that are commonly considered. Graphs are one of the prime objects of study in discrete mathematics.
Applications
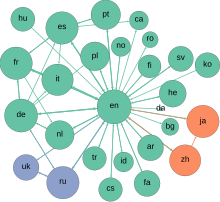
Graphs can be used to model many types of relations and processes in physical, biological,[7][8] social and information systems. Many practical problems can be represented by graphs. Emphasizing their application to real-world systems, the term network is sometimes defined to mean a graph in which attributes (e.g. names) are associated with the vertices and edges, and the subject that expresses and understands the real-world systems as a network is called network science.

Computer science
In computer science, graphs are used to represent networks of communication, data organization, computational devices, the flow of computation, etc. For instance, the link structure of a website can be represented by a directed graph, in which the vertices represent web pages and directed edges represent links from one page to another. A similar approach can be taken to problems in social media, travel, biology, computer chip design, mapping the progression of neuro-degenerative diseases, and many other fields. The development of algorithms to handle graphs is therefore of major interest in computer science. The transformation of graphs is often formalized and represented by graph rewrite systems. Complementary to graph transformation systems focusing on rule-based in-memory manipulation of graphs are graph databases geared towards transaction-safe, persistent storing and querying of graph-structured data
Physics and chemistry
Graph theory is also used to study molecules in chemistry and physics. In condensed matter physics, the three-dimensional structure of complicated simulated atomic structures can be studied quantitatively by gathering statistics on graph-theoretic properties related to the topology of the atoms. Also, "the Feynman graphs and rules of calculation summarize quantum field theory in a form in close contact with the experimental numbers one wants to understand." In chemistry a graph makes a natural model for a molecule, where vertices represent atoms and edges bonds. This approach is especially used in computer processing of molecular structures, ranging from chemical editors to database searching. In statistical physics, graphs can represent local connections between interacting parts of a system, as well as the dynamics of a physical process on such systems. Similarly, in computational neuroscience graphs can be used to represent functional connections between brain areas that interact to give rise to various cognitive processes, where the vertices represent different areas of the brain and the edges represent the connections between those areas. Graph theory plays an important role in electrical modeling of electrical networks, here, weights are associated with resistance of the wire segments to obtain electrical properties of network structures. Graphs are also used to represent the micro-scale channels of porous media, in which the vertices represent the pores and the edges represent the smaller channels connecting the pores. Chemical graph theory uses the molecular graph as a means to model molecules. Graphs and networks are excellent models to study and understand phase transitions and critical phenomena. Removal of nodes or edges lead to a critical transition where the network breaks into small clusters which is studied as a phase transition. This breakdown is studied via percolation theory.
Social sciences
Graph theory is also widely used in sociology as a way, for example, to measure actors' prestige or to explore rumor spreading, notably through the use of social network analysis software. Under the umbrella of social networks are many different types of graphs. Acquaintanceship and friendship graphs describe whether people know each other. Influence graphs model whether certain people can influence the behavior of others. Finally, collaboration graphs model whether two people work together in a particular way, such as acting in a movie together.
Biology
Likewise, graph theory is useful in biology and conservation efforts where a vertex can represent regions where certain species exist (or inhabit) and the edges represent migration paths or movement between the regions. This information is important when looking at breeding patterns or tracking the spread of disease, parasites or how changes to the movement can affect other species.
Graph theory is also used in connectomics; nervous systems can be seen as a graph, where the nodes are neurons and the edges are the connections between them.
Mathematics
In mathematics, graphs are useful in geometry and certain parts of topology such as knot theory. Algebraic graph theory has close links with group theory. Algebraic graph theory has been applied to many areas including dynamic systems and complexity.
Other topics
A graph structure can be extended by assigning a weight to each edge of the graph. Graphs with weights, or weighted graphs, are used to represent structures in which pairwise connections have some numerical values. For example, if a graph represents a road network, the weights could represent the length of each road. There may be several weights associated with each edge, including distance (as in the previous example), travel time, or monetary cost. Such weighted graphs are commonly used to program GPS's, and travel-planning search engines that compare flight times and costs.
Graph drawing
Graphs are represented visually by drawing a point or circle for every vertex, and drawing a line between two vertices if they are connected by an edge. If the graph is directed, the direction is indicated by drawing an edge.
A graph drawing should not be confused with the graph itself (the abstract, non-visual structure) as there are several ways to structure the graph drawing. All that matters is which vertices are connected to which others by how many edges and not the exact layout. In practice, it is often difficult to decide if two drawings represent the same graph. Depending on the problem domain some layouts may be better suited and easier to understand than others.
The pioneering work of W. T. Tutte was very influential on the subject of graph drawing. Among other achievements, he introduced the use of linear algebraic methods to obtain graph drawings.
Graph drawing also can be said to encompass problems that deal with the crossing number and its various generalizations. The crossing number of a graph is the minimum number of intersections between edges that a drawing of the graph in the plane must contain. For a planar graph, the crossing number is zero by definition.
Drawings on surfaces other than the plane are also studied.


No comments:
Post a Comment